Skip to content
ProductiveMedic
  • DDx
  • Templates
  • Pathways
  • Ramadan
  • Dermatology
  • ECG
  • Search Engine
  • Contact us
ProductiveMedic
  • DDx
  • Templates
  • Pathways
  • Ramadan
  • Dermatology
  • ECG
  • Search Engine
  • Contact us
    • ECG MADE EASIER

      Follow me for updates: Follow me for updates
      Sourced and adapted from LITFL ECG Library
      Review ECG wave nomenclature


      All ECGs must be interpreted in conjunction with a clinical history which is vital to establish a diagnosis

      MUST NOT MISS ECG FINDINGS


      Assess the rate and rhythm

      There are multiple methods to estimate the rate:

      We can calculate the beats per minute (bpm) by dividing 1500 by the number of SMALL squares between two R waves (R-R interval = one beat)

      We can calculate the beats per minute (bpm) by dividing 300 by the number of LARGE squares between two R waves (R-R interval = one beat)

      REGULAR rhythms

      • Rate = 300 / number of LARGE squares between consecutive R waves.

      Very FAST rhythms

      • Rate = 1500 / number of SMALL squares between consecutive R waves.

      SLOW or IRREGULAR rhythms

      • Rate = Number of R waves X 6
      • The number of complexes (count R waves) on the rhythm strip gives the average rate over a ten-second period. This is multiplied by 6 (10 seconds x 6 = 1 minute) to give the average Beats per minute (bpm)

      Interpretation (adults)
      • Normal: 60–100 beats/min
      • Tachycardia: >100 beats/min
      • Bradycardia: <60 beats/min

      [SOURCE: LITFL]

      • ECG RATE INTERPRETATION
      • Normal Heart Rate: 60 - 100 bpm
      • Bradycardia: < 60 bpm | Bradycardia DDx
      • Tachycardia: > 100 bpm | Tachycardia DDx

      ECG Rhythm Evaluation

      The rhythm is best analyzed by looking at a rhythm strip. On a 12 lead ECG this is usually a 10 second recording from Lead II.

      • Confirm or corroborate any findings in this lead by checking the other leads.
      • A longer rhythm strip, recorded perhaps recorded at a slower speed, may be helpful.

      Pattern of QRS complexes

      • Regular or irregular?
      • If irregular is it regularly irregular or irregularly irregular?

      [SOURCE: LITFL]

      • ECG RHYTHM EVALUATION
      • Determine the rhythm regularity
      • Normal Sinus Rhythm <div class="navybox"> <h3><strong>ECG features of normal sinus rhythm</strong></h3> <ul> <li>Regular rhythm at a rate of 60-100 bpm (or age-appropriate rate in <a href="https://litfl.com/paediatric-ecg-interpretation-ecg-library/">children</a>)</li> <li>Each QRS complex is preceded by a <a href="https://litfl.com/p-wave-ecg-library/">normal P wave</a></li> <li>Normal P wave axis: P waves upright in leads I and II, inverted in aVR</li> <li>The <a href="https://litfl.com/pr-interval-ecg-library/">PR interval</a> remains constant</li> <li>QRS complexes &lt; 100 ms wide (unless co-existent <a href="https://litfl.com/interventricular-conduction-delay-qrs-widening/">interventricular conduction delay</a> present)</li> </ul> <div class="yellowbackground"> <p style="text-align: center;"><strong>A regular, narrow-complex heart rhythm at 60-100 bpm</strong></p> </div> <p style="text-align: right;"><a href="https://litfl.com/normal-sinus-rhythm-ecg-library/" target="_blank" rel="noopener"><strong>[SOURCE: LITFL]</strong></a></p> </div>
      • AV block: 2nd degree, Mobitz I (Wenckebach)
      • Ventricular bigeminy/trigeminy
      • Atrial flutter (with 2:1 block alternating with 4:1 block - net HR = 100)
      • Sinus Arrhytmia
      • Atrial Fibrillation
      • Atrial Flutter
      • Multifocal atrial Tachycardia
      • AV Block: 2nd degree, Mobitz II
    • Normal QRS width is 70-100 ms (a duration of 110 ms is sometimes observed in healthy subjects).

      QRS morphology

      • Narrow complex: sinus, atrial or junctional origin.
      • Wide complex: ventricular origin, or supraventricular with aberrant conduction.

      [SOURCE: LITFL]

    • VT vs SVT || VT vs SVT with aberration - cheat sheet

      • QRS COMPLEX
      • Narrow complexes (QRS < 100 ms) are supraventricular in origin
      • QRS COMPLEX
      • Broad complexes (QRS > 100 ms) may be either ventricular in origin, or due to aberrant conduction of supraventricular complexes (e.g. due to bundle branch block, hyperkalaemia or sodium-channel blockade).
    • Regular Narrow complex tachycardias

      • Sinus tachycardia
      • Atrial tachycardia
      • Atrial flutter
      • Supraventricular tachycardia
      • AVNRT
      • Orthodromic AVRT
      • Narrow complex VT (fascicular tachycardia)
    • Irregular Narrow complex tachycardias

      • Tachycardia with PACs, PJCs, PVCs
      • Atrial fibrillation
      • Atrial flutter with variable block
      • Atrial tachycardia with variable block
      • Multifocal atrial tachycardia
      • Paroxysmal atrial tachycardia
      • Digoxin toxicity
    • Regular Wide complex tachycardias

      • Monomorphic VT
      • Ventricular flutter
      • Antidromic AVRT
      • Pacemaker tachycardia
      • Accelerated idioventricular rhythm (AIVR)
      • Sodium channel blocker toxicity (e.g. tricyclic antidepressants, cocaine)
      • Hyperkalemia
      • Post-electrical cardioversion
      • Ischaemia
      • Regular tachycardia with aberrancy, bundle branch block or pre-excitation syndromes
    • Irregular wide complex tachycardias

      • Polymorphic VT (torsades de pointes)
      • Irregular VT
      • Ventricular fibrillation
      • Irregular tachycardia with aberrancy, bundle branch block or pre-excitation syndromes
      • Atrial fibrillation or flutter with pre-excitation syndromes
    • Regular Narrow complex bradydysrhythmias

      • Sinus bradycardia
      • Junctional bradycardia = junctional rhythm at a rate of < 40 bpm
      • Complete AV block (junctional escape)
      • Atrial flutter with high degree AV block
    • Irregular Narrow complex bradydysrhythmias

      • Sinus arrhythmia, pause or arrest
      • Sinoatrial exit block (second degree)
      • Atrial fibrillation with slow ventricular response
      • Atrial flutter with variable block
      • Second degree AV block, type I
      • Second degree AV block, type II
    • Regular Wide complex bradydysrhythmias

      • Idioventricular rhythm
      • Complete AV block (ventricular escape)
      • Sinoventricular rhythm
      • Regular bradycardias with aberrancy or bundle branch block
    •  Irregular Wide complex bradydysrhythmias

      • Second degree AV block, type I
      • Second degree AV block, type II
      • Sinoatrial exit block (second degree) with bundle branch block
      • Irregular bradycardias with bundle branch block

      Characteristics of the Normal Sinus P Wave

      Morphology

      • Smooth contour
      • Monophasic in lead II
      • Biphasic in V1

      Axis

      • P waves should be upright in leads I and II, inverted in aVR

      Duration

      • < 0.12 s (<120ms or 3 small squares)

      Amplitude

      • < 2.5 mm (0.25mV) in the limb leads
      • < 1.5 mm (0.15mV) in the precordial leads

      Atrial abnormalities are most easily seen in the inferior leads (II, III and aVF) and lead V1, as the P waves are most prominent in these leads.

      [SOURCE: LITFL - P waves]

      Common P wave abnormalities include:

      • P mitrale: (bifid P waves), seen with left atrial enlargement.
      • P pulmonale (peaked P waves), seen with right atrial enlargement.
      • P wave inversion seen with ectopic atrial and junctional rhythms.
      • Variable P wave morphology seen in multifocal atrial rhythms.
      • Absent: sinus arrest, atrial fibrillation

      [SOURCE: LITFL]

      • P WAVE
      • Normal P-wave Morphology – Lead II
      • Abnormal P-wave Morphology – Lead II and V1
      • Atrial fibrillation
      • Sinus pause / arrest

    • Assess the relationship between atrial and ventricular activity ⇛ ECG CONDUCTION BLOCKS

      PR Interval

      The PR interval is the time from the onset of the P wave to the start of the QRS complex. It reflects conduction through the AV node.

      • The normal PR interval is between 120 – 200 ms (0.12-0.20s) in duration (three to five small squares).
      • If the PR interval is > 200 ms, first degree heart block is said to be present.
      • PR interval < 120 ms suggests pre-excitation (the presence of an accessory pathway between the atria and ventricles) or AV nodal (junctional) rhythm.
      AV nodal (junctional) rhythm
      • Junctional rhythms are narrow complex, regular rhythms arising from the AV node.
      • P waves are either absent or abnormal (e.g. inverted) with a short PR interval (=retrograde P waves).
      • ECG: Accelerated junctional rhythm demonstrating inverted P waves with a short PR interval (retrograde P waves)
      AJR AV nodal (junctional) rhythm

      [SOURCE: LITFL]

      • PR INTERVAL
      • Normal PR interval = 120 – 200 ms (3-5 small squares)
      • PR interval < 120 ms suggests:
        • Pre-excitation (the presence of an accessory pathway between the atria and ventricles) or 
        • AV nodal (junctional) rhythm
      • If the PR interval is > 200 ms, first-degree AV block is said to be present
      • May occur in isolation or co-exist with other blocks (e.g., second-degree AV block, trifascicular block)
      • Normal Sinus Rhythm <div class="navybox"> <h3><strong>ECG features of normal sinus rhythm</strong></h3> <ul> <li>Regular rhythm at a rate of 60-100 bpm (or age-appropriate rate in <a href="https://litfl.com/paediatric-ecg-interpretation-ecg-library/">children</a>)</li> <li>Each QRS complex is preceded by a <a href="https://litfl.com/p-wave-ecg-library/">normal P wave</a></li> <li>Normal P wave axis: P waves upright in leads I and II, inverted in aVR</li> <li>The <a href="https://litfl.com/pr-interval-ecg-library/">PR interval</a> remains constant</li> <li>QRS complexes &lt; 100 ms wide (unless co-existent <a href="https://litfl.com/interventricular-conduction-delay-qrs-widening/">interventricular conduction delay</a> present)</li> </ul> <div class="yellowbackground"> <p style="text-align: center;"><strong>A regular, narrow-complex heart rhythm at 60-100 bpm</strong></p> </div> <p style="text-align: right;"><a href="https://litfl.com/normal-sinus-rhythm-ecg-library/" target="_blank" rel="noopener"><strong>[SOURCE: LITFL]</strong></a></p> </div>
      • AV Blocks compared
      • AV Blocks compared
      • First Degree AV Block
        • PR interval > 200ms (5 small squares)
      • AV Blocks compared
      • AV block: 2nd degree, Mobitz I
      • AV block: 2nd degree, Mobitz II
      • AV block: 2nd degree, “fixed ratio blocks” (2:1, 3:1)
      • AV block: 2nd degree, “high grade AV block”
      • AV Blocks compared
      • AV block: 3rd degree (complete heart block)

    • Assess QRS axis and QRS morphology ⇛ AXIS INTERPRETATION || QRS COMPLEX || Q WAVE || R WAVE || DELTA WAVE

      • Axis and Lead Diagram
      • Right Axis Deviation (RAD)
      Causes of RAD
      • Left posterior fascicular block
      • Lateral myocardial infarction
      • Right ventricular hypertrophy
      • Acute lung disease (e.g. Pulmonary Embolus)
      • Chronic lung disease (e.g. COPD)
      • Ventricular ectopy
      • Hyperkalaemia
      • Sodium-channel blocker toxicity
      • WPW syndrome
      • Normal in children or thin adults with a horizontally positioned heart
      • Left Axis Deviation LAD
      Causes of LAD
      • Left anterior fascicular block
      • Left bundle branch block
      • Left ventricular hypertrophy
      • Inferior MI
      • Ventricular ectopy
      • Paced rhythm
      • Wolff-Parkinson White syndrome
      • Normal Axis (0 to +90°)
      • Normal Axis [LAD PHYSIOLOGICAL] (0 to -30°)
      • LAD PATHOLOGICAL (-30° to -90°)
      • RAD (90° to 180°)
      • Extreme Axis (-90° to -180°)
      • Normal Axis (0 to -30°)
      • LAFB | LPFB | RBBB | LBBB Criteria
      • Right Bundle Branch Block (RBBB)
      • Diagnostic criteria
        • QRS duration > 120ms
        • RSR’ pattern in V1-3 (“M-shaped” QRS complex)
        • Wide, slurred S wave in lateral leads (I, aVL, V5-6)
      Causes of RBBB
      • Right ventricular hypertrophy / cor pulmonale
      • Pulmonary embolus
      • Ischaemic heart disease
      • Rheumatic heart disease
      • Congenital heart disease (e.g. atrial septal defect)
      • Myocarditis
      • Cardiomyopathy
      • Lenègre-Lev disease: primary degenerative disease (fibrosis) of the conducting system
      • Left Anterior Fascicular Block (LAFB)
      • ECG criteria
        • Left axis deviation (usually -45 to -90 degrees)
        • qR complexes in leads I, aVL
        • rS complexes in leads II, III, aVF
        • Prolonged R wave peak time in aVL > 45ms
      • Bifascicular Block
      • Diagnostic criteria
        • RBBB + LAFB (manifested as LAD)
        • RBBB + LPFB (manifested as RAD)
      • Left Bundle Branch Block (LBBB)
      • Diagnostic criteria
        • QRS duration > 120ms
        • Dominant S wave in V1
        • Broad monophasic R wave in lateral leads (I, aVL, V5-6)
        • Absence of Q waves in lateral leads
        • Prolonged R wave peak time > 60ms in leads V5-6
      Causes of LBBB  

      It is unusual for LBBB to exist in the absence of organic disease. Causes are varied and include:

      • Aortic stenosis
      • Ischaemic heart disease
      • Hypertension
      • Dilated cardiomyopathy
      • Anterior MI
      • Lenègre-Lev disease: primary degenerative disease (fibrosis) of the conducting system
      • Hyperkalaemia
      • Digoxin toxicity
      • Left Posterior Fascicular Block (LPFB)
      • ECG criteria
        • Right axis deviation (RAD) (> +90 degrees)
        • rS complexes in leads I and aVL
        • qR complexes in leads II, III and aVF
        • Prolonged R wave peak time in aVF
      • Trifascicular Block
      • Diagnostic criteria
        • True trifascicular block refers to the presence of conduction delay in all three fascicles below the AV node (RBBB, LAFB, LPFB), manifesting as bifascicular block and 3rd degree AV block. One of two ECG patterns is present:
          • 3rd degree AV block + RBBB + LAFB or
          • 3rd degree AV block + RBBB + LPFB
        • Incomplete trifascicular block
          • 1st degree AV block + RBBB + LAFB or
          • 1st degree AV block + RBBB + LPFB
    • Small ‘septal’ Q waves are typically seen in the left-sided leads (I, aVL, V5 and V6)
      • QRS abnormalities
      • RVH vs LVH pattern
      • Low voltage QRS | Definition
      • Pathological Q Waves
      • Q waves are considered pathological if:
        • > 40 ms (1 mm) wide
        • > 2 mm deep
        • > 25% of depth of QRS complex
        • Seen in leads V1-3
      • Pathological Q waves usually indicate current or prior myocardial infarction.
      • Right Ventricular Hypertrophy (RVH)
      • Diagnostic criteria
        • Right axis deviation of +110° or more.
        • Dominant R wave in V1 (> 7mm tall or R/S ratio > 1).
        • Dominant S wave in V5 or V6 (> 7mm deep or R/S ratio < 1).
        • QRS duration < 120ms (i.e. changes not due to RBBB).
      Causes of RVH
      • Pulmonary hypertension
      • Mitral stenosis
      • Pulmonary embolism
      • Chronic lung disease (cor pulmonale)
      • Congenital heart disease (e.g. Tetralogy of Fallot, pulmonary stenosis)
      • Arrhythmogenic right ventricular cardiomyopathy
      • Left Ventricular Hypertrophy (LVH)
      • Diagnostic criteria
        • Voltage criteria must be accompanied by non-voltage criteria to be considered diagnostic of LVH. <div class="navybox"> <h3><strong>Voltage Criteria</strong></h3> <p><em>Limb Leads</em></p> <ul> <li>R wave in lead I + S wave in lead III &gt; 25 mm</li> <li>R wave in aVL &gt; 11 mm</li> <li>R wave in aVF &gt; 20 mm</li> <li>S wave in aVR &gt; 14 mm</li> </ul> <p><em>Precordial Leads</em></p> <ul> <li>R wave in V4, V5 or V6  &gt; 26 mm</li> <li>R wave in V5 or V6 plus S wave in V1 &gt; 35 mm</li> <li>Largest R wave plus largest S wave in precordial leads &gt; 45 mm</li> </ul> <div class="wp-block-genesis-blocks-gb-spacer gb-block-spacer gb-divider-dashed gb-spacer-divider gb-divider-size-1"><hr /></div> <h3 id="h-non-voltage-criteria"><strong>Non Voltage Criteria</strong></h3> <ul> <li><a href="https://litfl.com/r-wave-peak-time-rwpt-ecg-library/" target="_blank" rel="noopener">Increased R wave peak time</a> &gt; 50 ms in leads V5 or V6</li> <li>ST segment depression and T wave inversion in the left-sided leads: <em>AKA</em> <em>the left ventricular ‘strain’ pattern</em></li> </ul> <p style="text-align: right;"><a href="https://litfl.com/left-ventricular-hypertrophy-lvh-ecg-library/" target="_blank" rel="noopener"><strong>[SOURCE: LITFL - LVH]</strong></a></p> </div>
        • LVH by voltage criteria
        • R wave in V5 or V6 plus S wave in V1 > 35 mm
        • LVH progressive ECG changes
      Causes of LVH
      • Hypertension (most common cause)
      • Aortic stenosis
      • Aortic regurgitation
      • Mitral regurgitation
      • Coarctation of the aorta
      • Hypertrophic cardiomyopathy
      Handy Tips
      • Voltage criteria alone are not diagnostic of LVH
      • ECG changes are an insensitive means of detecting LVH (patients with clinically significant left ventricular hypertrophy seen on echocardiography may still have a relatively normal ECG)

    • Assess the ST segments, T waves and QT interval ⇛ S-T SEGMENT || T WAVES || QT INTERVAL 

      Specifically inspect all the leads for Ischaemic changes <div class="redbox"> <ul> <li><strong>Check all the leads for ischaemic changes:</strong> <ul> <li>Hyperacute T waves</li> <li>ST-segment elevation/depression</li> <li>Q waves</li> <li>T wave inversion</li> </ul> </li> </ul> </div>

      The progression of ECG findings seen during acute coronary occlusion and reperfusion.

    • The flat, isoelectric section of the ECG between the end of the S wave (the J point) and the beginning of the T wave

      S-T Segment

      The ST segment is the flat, isoelectric section of the ECG between the end of the S wave (the J point) and the beginning of the T wave.
      • The ST Segment represents the interval between ventricular depolarization and repolarization.
      • The most important cause of ST segment abnormality (elevation or depression) is myocardial ischaemia or infarction.
      Morphology of the Elevated ST segment Myocardial Infarction ECG Complex ST segment elevation 
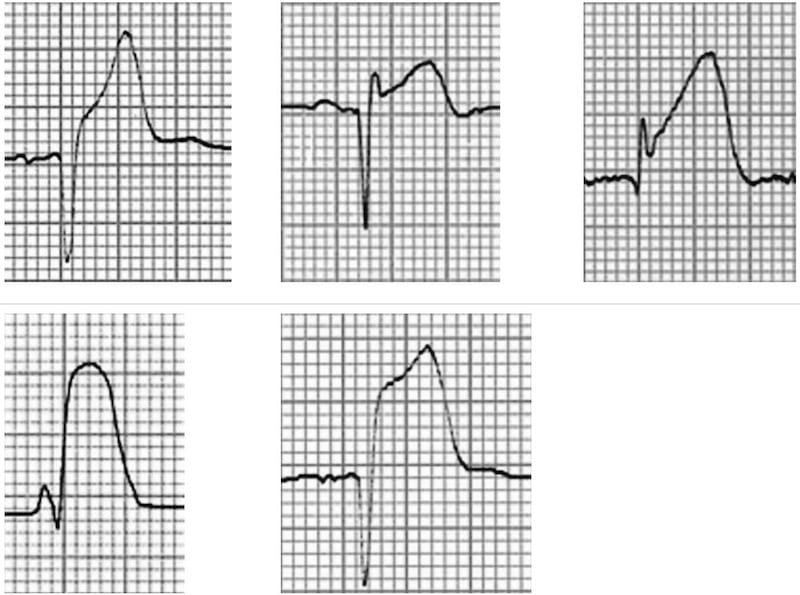
Acute STEMI may produce ST elevation with either concave, convex or obliquely straight morphology. 
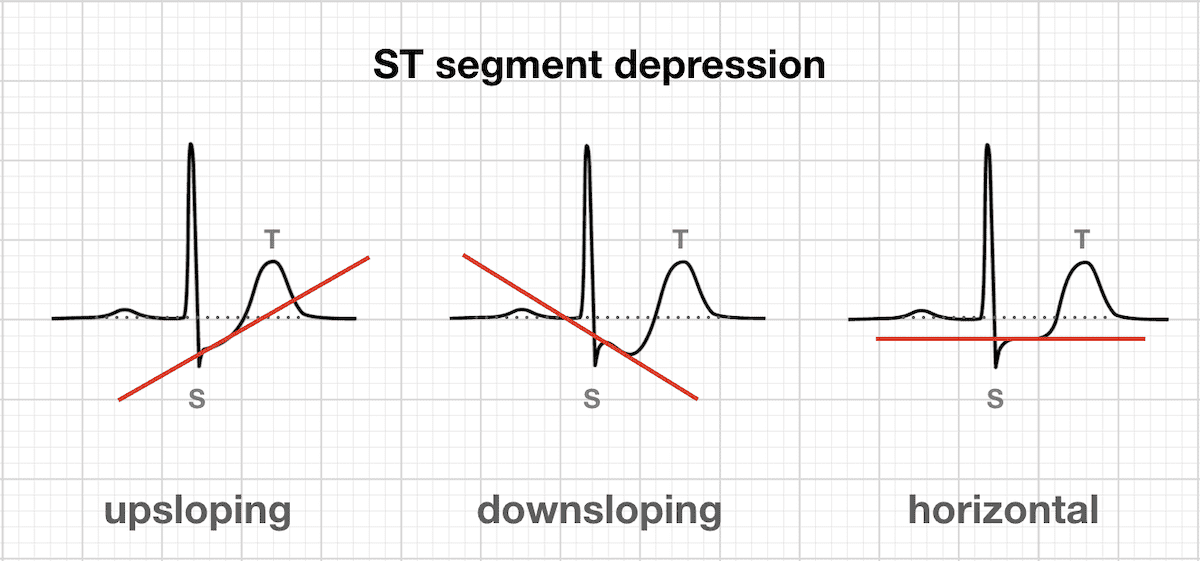
Morphology of ST Depression
      • ST depression can be either upsloping, downsloping, or horizontal.
      • Horizontal or downsloping ST depression ≥ 0.5 mm at the J-point in ≥ 2 contiguous leads indicates myocardial ischaemia.
      • Upsloping ST depression in the precordial leads with prominent De Winter T waves is highly specific for occlusion of the LAD.
      • Reciprocal change has a morphology that resembles “upside down” ST elevation and is seen in leads electrically opposite to the site of infarction.
      • Posterior MI manifests as horizontal ST depression in V1-3 and is associated with upright T waves and tall R waves.
      ST Segment depression

      [SOURCE: LITFL - ST Segment]

    • | ST elevation DDx || STEMI equivalents || STEMI mimics || STEMI vs Early repolarisation |

      | STEMI criteria || Ischaemic T waves || MI localisation || Sgarbossa criteria (Ischaemia in LBBB) | 

      • Measuring ST segment changes
      • ST segment elevation/depression
      • Subtle Anterior STEMI Calculator
      • A+E HE-MACS stratification
      • Measuring ST segment changes
      • STEMI vs NSTEMI
      • A+E HE-MACS stratification
      Causes of ST Depression
      • Myocardial ischaemia / NSTEMI
      • Reciprocal change in STEMIPosterior MI
      • Digoxin effect
      • Hypokalaemia
      • Supraventricular tachycardia
      • Right bundle branch block
      • Right ventricular hypertrophy
      • Left bundle branch block
      • Left ventricular hypertrophy
      • Ventricular paced rhythm
      • Measuring ST segment changes
      • STEMI vs NSTEMI
      • Subtle Anterior STEMI Calculator
      • A+E HE-MACS stratification
      Causes of ST Segment Elevation
      • Acute myocardial infarction
      • Coronary vasospasm (Printzmetal’s angina)
      • Pericarditis
      • Benign early repolarization
      • Left bundle branch block
      • Left ventricular hypertrophy
      • Ventricular aneurysm
      • Brugada syndrome
      • Ventricular paced rhythm
      • Raised intracranial pressure
      • Takotsubo Cardiomyopathy
      Patterns of ST elevation in contiguous leads

      Follow the links to find out more about the different STEMI patterns:

      • Septal (V1-2)
      • Anterior (V3-4)
      • Lateral (I + aVL, V5-6)
      • Inferior (II, III, aVF)
      • Right ventricular (V1, V4R)
      • Posterior (V7-9)
    • Upright in all leads except aVR and V1. Amplitude < 5mm in limb leads and < 10mm in precordial leads.
    • Ischaemic T waves || De Winter's T waves || Wellens' Sign 

      • T waves: Normal vs Abnormal
      • T waves: Normal vs Abnormal
      • BER vs vs hyperacute vs peaked T waves
      Prominent T-wave causes
      • Acute myocardial ischemia (i.e. hyperacute STEMI)
      • Hyperkalaemia
      • Acute pericarditis
      • LVH
      • Benign early repolarization
      • Bundle branch block (LBBB / RBBB)
      • Preexcitation syndromes
      • T waves: Normal vs Abnormal
      • ST depression and T wave inversion
      • T wave inversion in lead III is a normal variant. New T-wave inversion (compared with prior ECGs) is always abnormal. Pathological T wave inversion is usually symmetrical and deep (>3mm).
      Inverted T waves are seen in the following conditions:
      • Normal finding in children
      • Persistent juvenile T wave pattern
      • Myocardial ischaemia and infarction (including Wellens Syndrome)
      • Bundle branch block
      • Ventricular hypertrophy (‘strain’ patterns)
      • Pulmonary embolism
      • Hypertrophic cardiomyopathy
      • Raised intracranial pressure
    • QTc is prolonged if > 440ms in men or > 460ms in women. QTc is abnormally short if < 350ms.
      • A useful rule of thumb is that a normal QT is less than half the preceding RR interval
      • How to measure the QT interval
      • Corrected QT interval calculator
      • QTc is abnormally short if < 350ms
      • How to measure the QT interval
      • Corrected QT interval calculator
      Causes of a short QTc (<350ms)
      • Hypercalcaemia
      • Congenital short QT syndrome
      • Digoxin effect
      • QTc is prolonged if > 440ms in men or > 460ms in women
      • QTc > 500 is associated with an increased risk of torsades de pointes
      • How to measure the QT interval
      • Corrected QT interval calculator
      Causes of a prolonged QTc (>440ms)
      • Hypokalaemia
      • Hypomagnesaemia
      • Hypocalcaemia
      • Hypothermia
      • Myocardial ischemia
      • ROSC Post-cardiac arrest
      • Raised intracranial pressure
      • Congenital long QT syndrome
      • Medications/Drugs

Feedback or report an error on this page

This website is for qualified medical professionals ONLY.

Nothing on this website may be regarded as clinical guidance, and should not be regarded as applicable to any specific case. The information contained on or accessed through this website is not intended to be comprehensive, therefore it is not to serve as a substitute for your own professional medical judgement when faced with an individual patient. All medical professionals are responsible for their own clinical decisions. We recommend you consult other professional sources and references prior to making any evaluation and/or treatment decisions.
Cookies (small data files) are stored on your computer so that we can recognise you and provide you with the best service. If you do not want to receive cookies please do not use ProductiveMedic.

Contact Us | Terms | Privacy policy | Cookie policy | Disclaimer
Copyright © 2023 Dr QuickNotes LTD